The penguins datasets#
In this notebook, we make a quick presentation of the Palmer penguins dataset dataset. We use this dataset for both classification and regression problems by selecting a subset of the features to make our explanations intuitive.
Classification dataset#
We use this dataset in classification setting to predict the penguins’ species from anatomical information.
Each penguin is from one of the three following species: Adelie, Gentoo, and Chinstrap. See the illustration below depicting the three different penguin species:

This problem is a classification problem since the target is categorical. We limit our input data to a subset of the original features to simplify our explanations when presenting the decision tree algorithm. Indeed, we use features based on penguins’ culmen measurement. You can learn more about the penguins’ culmen with the illustration below:

We start by loading this subset of the dataset.
import pandas as pd

penguins = pd.read_csv("../datasets/penguins_classification.csv")

culmen_columns = ["Culmen Length (mm)", "Culmen Depth (mm)"]
target_column = "Species"
Let’s check the dataset more into details.
penguins
| Culmen Length (mm) | Culmen Depth (mm) | Species | |
|---|---|---|---|
| 0 | 39.1 | 18.7 | Adelie |
| 1 | 39.5 | 17.4 | Adelie |
| 2 | 40.3 | 18.0 | Adelie |
| 3 | 36.7 | 19.3 | Adelie |
| 4 | 39.3 | 20.6 | Adelie |
| ... | ... | ... | ... |
| 337 | 55.8 | 19.8 | Chinstrap |
| 338 | 43.5 | 18.1 | Chinstrap |
| 339 | 49.6 | 18.2 | Chinstrap |
| 340 | 50.8 | 19.0 | Chinstrap |
| 341 | 50.2 | 18.7 | Chinstrap |
342 rows × 3 columns
Since that we have few samples, we can check a scatter plot to observe the samples distribution.
import seaborn as sns

pairplot_figure = sns.pairplot(penguins, hue="Species")
pairplot_figure.fig.set_size_inches(9, 6.5)
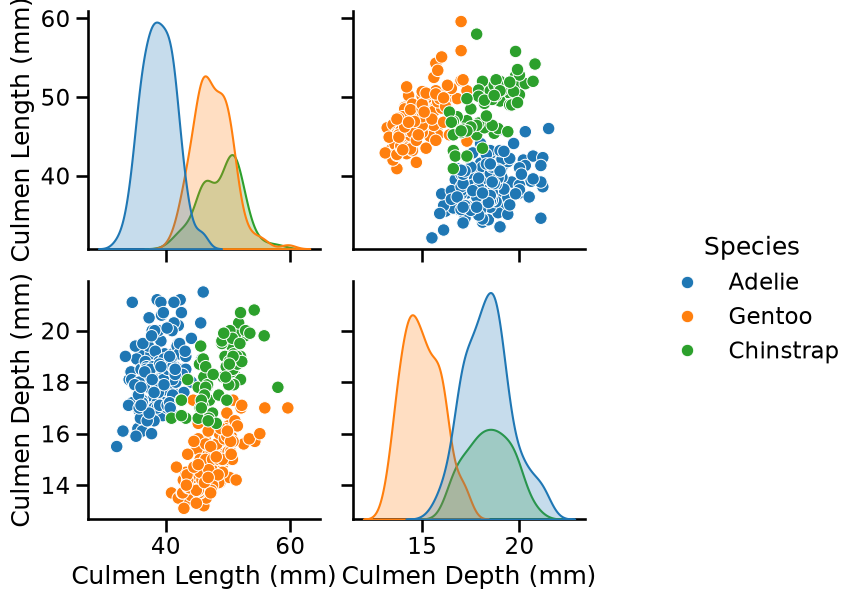
First let’s check the feature distributions by looking at the diagonal plots of the pairplot. We can deduce the following intuitions:
The Adelie species can be differentiated from the Gentoo and Chinstrap species depending on the culmen length;
The Gentoo species can be differentiated from the Adelie and Chinstrap species depending on the culmen depth.
Regression dataset#
In a regression setting, the target is a continuous variable instead of categories. Here, we use two features of the dataset to make such a problem: the flipper length is used as data and the body mass as the target. In short, we want to predict the body mass using the flipper length.
We load the dataset and visualize the relationship between the flipper length and the body mass of penguins.
penguins = pd.read_csv("../datasets/penguins_regression.csv")

feature_name = "Flipper Length (mm)"
target_column = "Body Mass (g)"
_ = sns.scatterplot(data=penguins, x=feature_name, y=target_column)
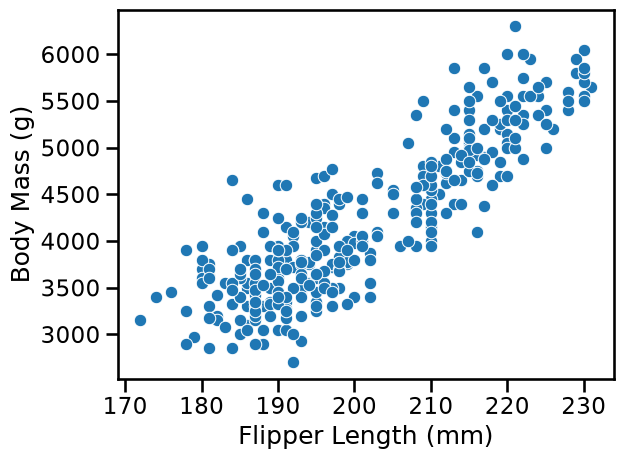
Here, we deal with a regression problem because our target is a continuous variable ranging from 2.7 kg to 6.3 kg. From the scatter plot above, we observe that we have a linear relationship between the flipper length and the body mass. The longer the flipper of a penguin, the heavier the penguin.