🏁 Wrap-up quiz 1#
This quiz requires some programming to be answered.
Open the dataset ames_housing_no_missing.csv with the following command:
import pandas as pd
ames_housing = pd.read_csv("../datasets/ames_housing_no_missing.csv")

target_name = "SalePrice"
data, target = ames_housing.drop(columns=target_name), ames_housing[target_name]
target = (target > 200_000).astype(int)
ames_housing is a pandas dataframe. The column “SalePrice” contains the
target variable.
We did not encounter any regression problem yet. Therefore, we convert the regression target into a classification target to predict whether or not an house is expensive. “Expensive” is defined as a sale price greater than $200,000.
Question
Use the data.info() and data.head() commands to examine the columns of
the dataframe. The dataset contains:
a) only numerical features
b) only categorical features
c) both numerical and categorical features
Select a single answer
Question
How many features are available to predict whether or not a house is expensive?
a) 79
b) 80
c) 81
Select a single answer
Question
How many features are represented with numbers?
a) 0
b) 36
c) 42
d) 79
Select a single answer
Hint: you can use the method
df.select_dtypes
or the function
sklearn.compose.make_column_selector
as shown in a previous notebook.
Refer to the dataset description regarding the meaning of the dataset.
Question
Among the following columns, which columns express a quantitative numerical value (excluding ordinal categories)?
a) “LotFrontage”
b) “LotArea”
c) “OverallQual”
d) “OverallCond”
e) “YearBuilt”
Select all answers that apply
We consider the following numerical columns:
numerical_features = [
  "LotFrontage", "LotArea", "MasVnrArea", "BsmtFinSF1", "BsmtFinSF2",
  "BsmtUnfSF", "TotalBsmtSF", "1stFlrSF", "2ndFlrSF", "LowQualFinSF",
  "GrLivArea", "BedroomAbvGr", "KitchenAbvGr", "TotRmsAbvGrd", "Fireplaces",
  "GarageCars", "GarageArea", "WoodDeckSF", "OpenPorchSF", "EnclosedPorch",
  "3SsnPorch", "ScreenPorch", "PoolArea", "MiscVal",
]
Now create a predictive model that uses these numerical columns as input data.
Your predictive model should be a pipeline composed of a
sklearn.preprocessing.StandardScaler
to scale these numerical data and a
sklearn.linear_model.LogisticRegression.
Question
What is the accuracy score obtained by 10-fold cross-validation (you can set
the parameter cv=10 when calling cross_validate) of this pipeline?
a) ~0.5
b) ~0.7
c) ~0.9
Select a single answer
Instead of solely using the numerical columns, let us build a pipeline that can process both the numerical and categorical features together as follows:
the
numerical_features(as defined above) should be processed as previously done with aStandardScaler;the left-out columns should be treated as categorical variables using a
sklearn.preprocessing.OneHotEncoder. To avoid any issue with rare categories that could only be present during the prediction, you can pass the parameterhandle_unknown="ignore"to theOneHotEncoder.
Question
What is the accuracy score obtained by 10-fold cross-validation of the pipeline using both the numerical and categorical features?
a) ~0.7
b) ~0.9
c) ~1.0
Select a single answer
One way to compare two models is by comparing their means, but small differences in performance measures might easily turn out to be merely by chance (e.g. when using random resampling during cross-validation), and not because one model predicts systematically better than the other.
Another way is to compare cross-validation test scores of both models fold-to-fold, i.e. counting the number of folds where one model has a better test score than the other. This provides some extra information: are some partitions of the data making the classification task particularly easy or hard for both models?
Let’s visualize the second approach.
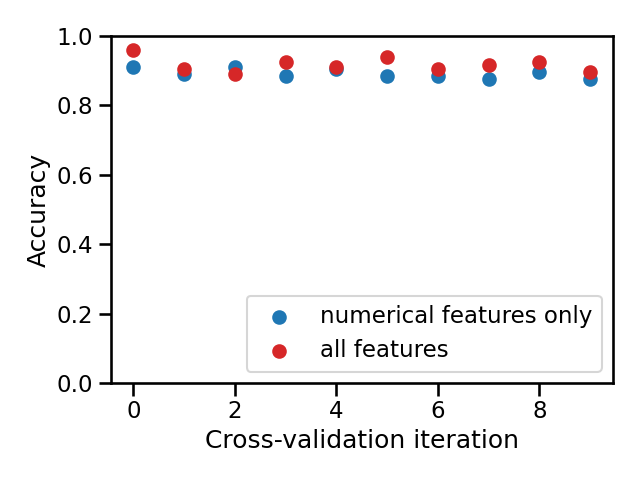
Question
Compare both models by counting on how many folds the model using all features has a better test score than the other. Select the correct statement:
a) [0, 3]: the model using all features is consistently worse
b) [4, 6]: both models are almost equivalent
c) [7, 10]: the model using all features is consistently better
Select a single answer
Note
It is normal for this module to take longer than expected for people who are discovering Python programming, but don’t get discouraged! The programming mechanisms will come with experience and the programming exercises in the following modules will seem more and more natural as time goes by.