📃 Solution for Exercise M6.04#
The aim of the exercise is to get familiar with the histogram gradient-boosting in scikit-learn. Besides, we will use this model within a cross-validation framework in order to inspect internal parameters found via grid-search.
We will use the California housing dataset.
from sklearn.datasets import fetch_california_housing

data, target = fetch_california_housing(return_X_y=True, as_frame=True)
target *= 100  # rescale the target in k$
First, create a histogram gradient boosting regressor. You can set the trees number to be large, and configure the model to use early-stopping.
# solution
from sklearn.ensemble import HistGradientBoostingRegressor

hist_gbdt = HistGradientBoostingRegressor(
    max_iter=1000, early_stopping=True, random_state=0
)
We will use a grid-search to find some optimal parameter for this model. In this grid-search, you should search for the following parameters:
max_depth: [3, 8];max_leaf_nodes: [15, 31];learning_rate: [0.1, 1].
Feel free to explore the space with additional values. Create the grid-search providing the previous gradient boosting instance as the model.
# solution
from sklearn.model_selection import GridSearchCV

params = {
    "max_depth": [3, 8],
    "max_leaf_nodes": [15, 31],
    "learning_rate": [0.1, 1],
}

search = GridSearchCV(hist_gbdt, params)
Finally, we will run our experiment through cross-validation. In this regard,
define a 5-fold cross-validation. Besides, be sure to shuffle the data.
Subsequently, use the function sklearn.model_selection.cross_validate to run
the cross-validation. You should also set return_estimator=True, so that we
can investigate the inner model trained via cross-validation.
# solution
from sklearn.model_selection import cross_validate
from sklearn.model_selection import KFold

cv = KFold(n_splits=5, shuffle=True, random_state=0)
results = cross_validate(
    search,
    data,
    target,
    cv=cv,
    return_estimator=True,
    # n_jobs=2  # Uncomment this if you run locally
)
Now that we got the cross-validation results, print out the mean and standard deviation score.
# solution
print(
    "R2 score with cross-validation:\n"
    f"{results['test_score'].mean():.3f} ± "
    f"{results['test_score'].std():.3f}"
)
R2 score with cross-validation:
0.839 ± 0.006
Then inspect the estimator entry of the results and check the best
parameters values. Besides, check the number of trees used by the model.
# solution
for estimator in results["estimator"]:
    print(estimator.best_params_)
    print(f"# trees: {estimator.best_estimator_.n_iter_}")
{'learning_rate': 0.1, 'max_depth': 3, 'max_leaf_nodes': 15}
# trees: 528
{'learning_rate': 0.1, 'max_depth': 8, 'max_leaf_nodes': 15}
# trees: 447
{'learning_rate': 0.1, 'max_depth': 3, 'max_leaf_nodes': 15}
# trees: 576
{'learning_rate': 0.1, 'max_depth': 8, 'max_leaf_nodes': 15}
# trees: 290
{'learning_rate': 0.1, 'max_depth': 8, 'max_leaf_nodes': 15}
# trees: 414
We observe that the parameters are varying. We can get the intuition that results of the inner CV are very close for certain set of parameters.
Inspect the results of the inner CV for each estimator of the outer CV. Aggregate the mean test score for each parameter combination and make a box plot of these scores.
# solution
import pandas as pd

index_columns = [f"param_{name}" for name in params.keys()]
columns = index_columns + ["mean_test_score"]

inner_cv_results = []
for cv_idx, estimator in enumerate(results["estimator"]):
    search_cv_results = pd.DataFrame(estimator.cv_results_)
    search_cv_results = search_cv_results[columns].set_index(index_columns)
    search_cv_results = search_cv_results.rename(
        columns={"mean_test_score": f"CV {cv_idx}"}
    )
    inner_cv_results.append(search_cv_results)
inner_cv_results = pd.concat(inner_cv_results, axis=1).T
import matplotlib.pyplot as plt

color = {"whiskers": "black", "medians": "black", "caps": "black"}
inner_cv_results.plot.box(vert=False, color=color)
plt.xlabel("R2 score")
plt.ylabel("Parameters")
_ = plt.title(
    "Inner CV results with parameters\n"
    "(max_depth, max_leaf_nodes, learning_rate)"
)
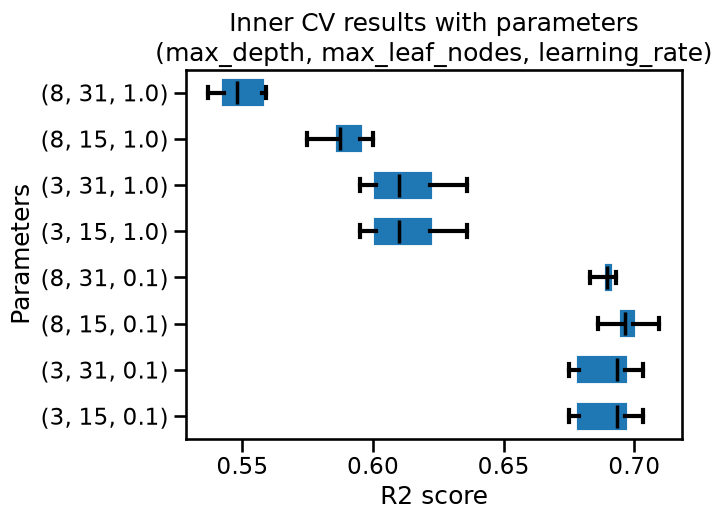
We see that the first 4 ranked set of parameters are very close. We could select any of these 4 combinations. It coincides with the results we observe when inspecting the best parameters of the outer CV.