📃 Solution for Exercise M1.01#
Imagine we are interested in predicting penguins species based on two of their body measurements: culmen length and culmen depth. First we want to do some data exploration to get a feel for the data.
What are the features? What is the target?
The features are "culmen length" and "culmen depth". The target is the
penguin species.
The data is located in ../datasets/penguins_classification.csv, load it with
pandas into a DataFrame.
# solution
import pandas as pd

penguins = pd.read_csv("../datasets/penguins_classification.csv")
Show a few samples of the data.
How many features are numerical? How many features are categorical?
Both features, "culmen length" and "culmen depth" are numerical. There are
no categorical features in this dataset.
# solution
penguins.head()
| Culmen Length (mm) | Culmen Depth (mm) | Species | |
|---|---|---|---|
| 0 | 39.1 | 18.7 | Adelie |
| 1 | 39.5 | 17.4 | Adelie |
| 2 | 40.3 | 18.0 | Adelie |
| 3 | 36.7 | 19.3 | Adelie |
| 4 | 39.3 | 20.6 | Adelie |
What are the different penguins species available in the dataset and how many
samples of each species are there? Hint: select the right column and use the
value_counts
method.
# solution
penguins["Species"].value_counts()
Species
Adelie       151
Gentoo       123
Chinstrap     68
Name: count, dtype: int64
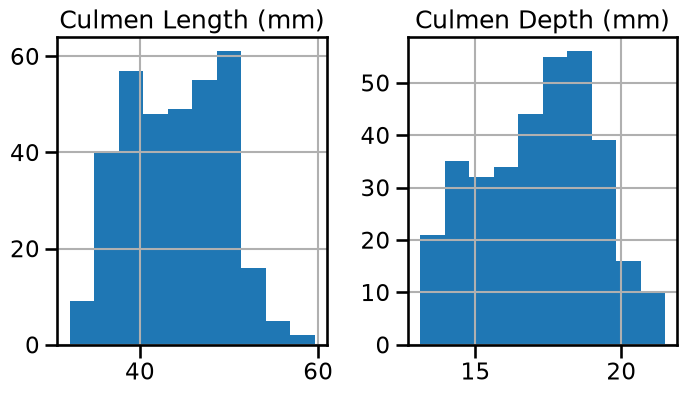
Plot histograms for the numerical features
# solution
_ = penguins.hist(figsize=(8, 4))
Show features distribution for each class. Hint: use
seaborn.pairplot
# solution
import seaborn

pairplot_figure = seaborn.pairplot(penguins, hue="Species")
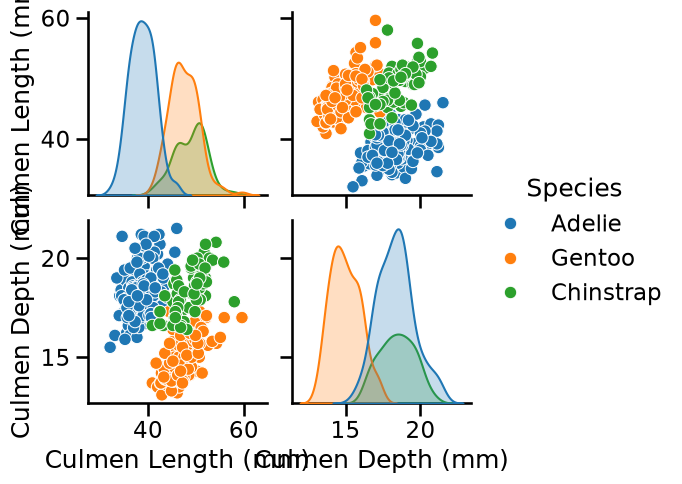
We observe that the labels on the axis are overlapping. Even if it is not the priority of this notebook, one can tweak them by increasing the height of each subfigure.
pairplot_figure = seaborn.pairplot(penguins, hue="Species", height=4)
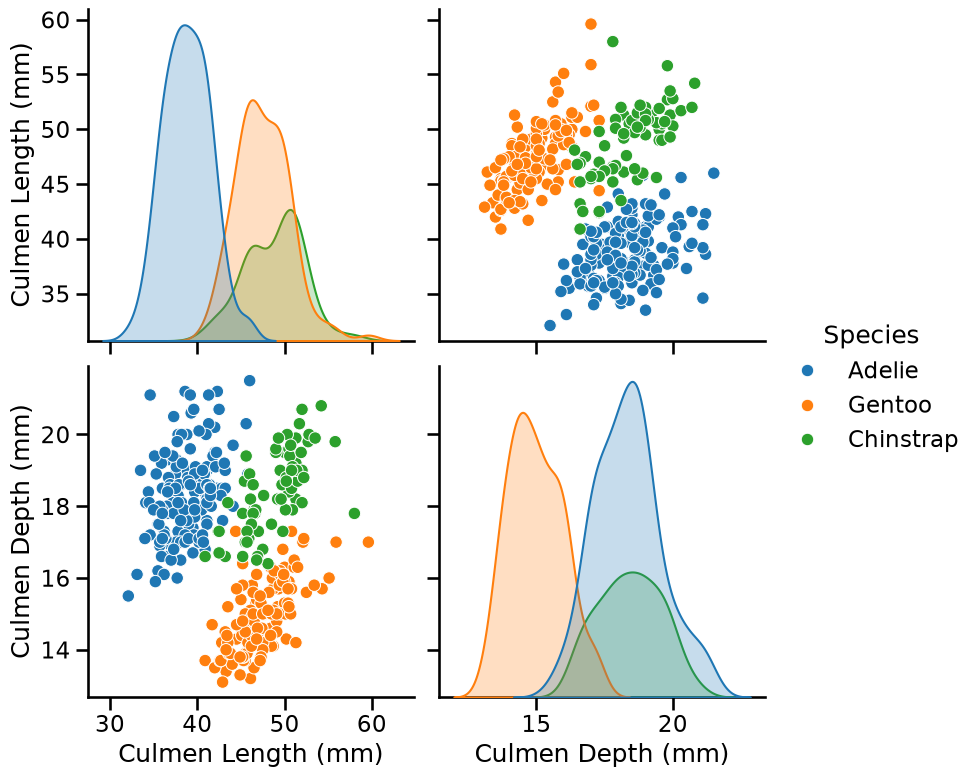
Looking at these distributions, how hard do you think it would be to classify
the penguins only using "culmen depth" and "culmen length"?
Looking at the previous scatter-plot showing "culmen length" and "culmen depth", the species are reasonably well separated:
low culmen length -> Adelie
low culmen depth -> Gentoo
high culmen depth and high culmen length -> Chinstrap
There is some small overlap between the species, so we can expect a statistical model to perform well on this dataset but not perfectly.